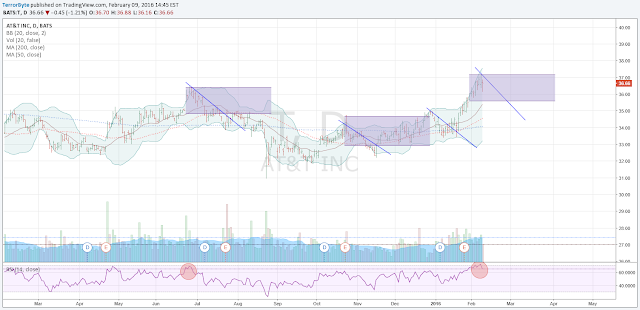
Was reading the newspaper yesterday and ran across an article about AT&T. I quickly jumped online to do a chart checkup and noticed a trend with the Bollinger Bands (BB). Every time the bar hit or surpassed the upper BB, the stock would begin it's downtrend to the middle band and then to the 50MA.
I purchased the Feb $36.5 put options for .38 cents around the $37 area right before the close. Closed at $37.11.
Watched the open and sold 2/3 of my position at .64 cents for a 52% gain. Holding on to the other 1/3 to see how the market reacts tomorrow with the Yellen hearing and because the markets have been volatile. Right now the put options are sitting at the purchase price of .38 cents.
UPDATE 11FEB16
Sold the last 3rd of my options today for .68 cents. I don't like holding into Fridays and plus, Monday is a holiday so I would've lost a day and some money. I still think it's going to continue down until it touches the BB middle band and maybe further.

No comments:
Post a Comment